Independent, non-commercial data projectUpdated September 2026Sources: NASA, NOAA, IPCC, IEA, World Bank
Global climate data and accountability
Track the path to zero.
Who caused the climate crisis. Who is paying for it. Who is doing something about it. All the numbers here come from trusted sources like NASA and the World Bank.
What is actually happening
Colour is disappearing from the world, in ways you can measure.
Smoke greys out skies that were blue. Bleaching turns living reef white and grey where colour used to be. Drought drains green land to dust. None of this is a metaphor, it shows up in the data below, place by place, year by year.
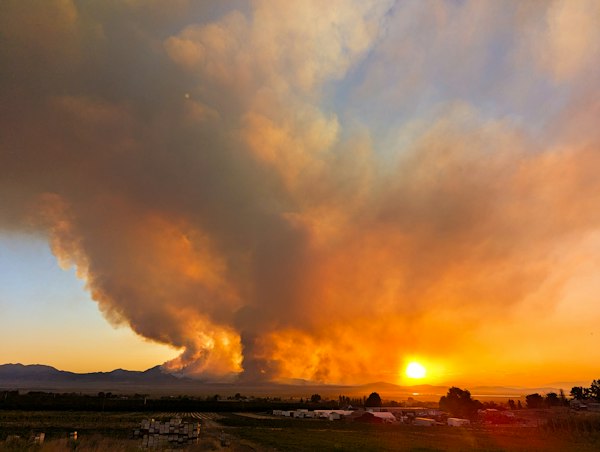
SmokeGlobal fire outbreaks hit a record high in early 2026, greying skies far beyond the fire itself.
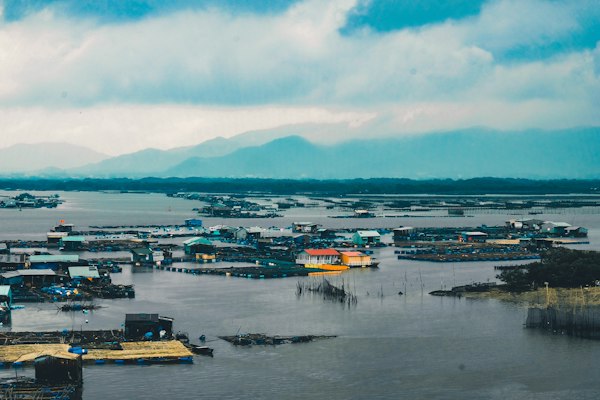
FloodingNow the foremost climate hazard worldwide, leaving grey silt where fields used to be.
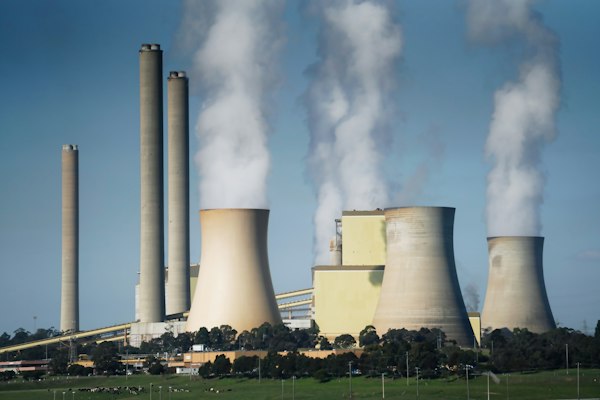
EmissionsCarbon pollution reached record levels again in 2025, the source the rest of this page traces back to.
"Ice sheet loss and Amazon degradation become irreversible the longer temperatures stay above 1.5°C."António Guterres, UN Secretary-General · UN News, 2 September 2026